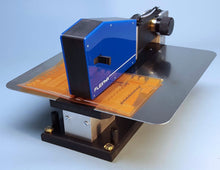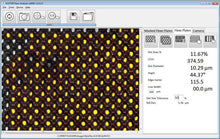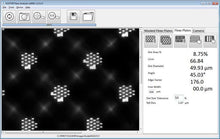
The new BetaFlex HR (High Resolution) Flexo Analyzer provides an easy and accurate method to analyze flexo plate, solid- and dot-surface, micro-structures at 43,000 ppi.
Easy and Accurate Way to Analyze Solid & Dot Surface Microstructures on Flexo Plates
FREE Beta ColorViewer III included with purchase ($399 value)!
Just as holes in an anilox roller surface allow an otherwise smooth surface to carry more ink, micro-screening (looks like dots on top of the dots) imaged onto flexo plates are playing a significant role in helping us carry more ink on the surface of the plate, allowing for increased densities that tend to be low due to the thin ink films we apply. More and more, plate surfaces are intentionally textured.
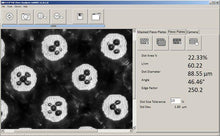
Where we used to measure and control the size of dots on a plate with a BetaFlex Pro, micro-screening resolutions have been too fine to conveniently measure in a printing environment. Now, with the BetaFlex HR (high-resolution) Flexo Analyzer, it is possible to measure and monitor the teeny-tiny, itsy-bitsy little dots on top of our process dots and make sure they come out of the processor the way they’re supposed to. It is now possible to standardize and monitor them!
From the Manufacturer: Micro-Structure patterns greatly improve ink transfer and dot fidelity, these patterns and textures are sensitive to variations in mask exposure and plate processing. They benefit from the same process control techniques provided by the BetaFlex Pro but require much higher magnification and resolution as provided by the BetaFlex HR.
Operating at 43,000 pixels per inch compared to the 14,000 ppi of the BetaFlex Pro, halftones as coarse as 175 lpi and plate patterns as fine as 1500 lpi are automatically analyzed for dot area, diameter, edge factor and more.
Operating in transmission mode only, the Betaflex HR provides critical insight into the most sophisticated screening techniques available today and is the perfect complement to the BetaFlex Pro which offers 3D Imaging (HD Flexo), 2D transmission, reflection color dot % analysis, as well as many other features.
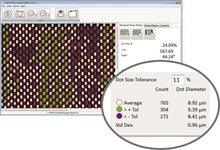
New statistical functions count and quantify the distribution of cell sizes above and below the user-specified target value.


